Integrated Genome Browser
Visualization for genome-scale data
-
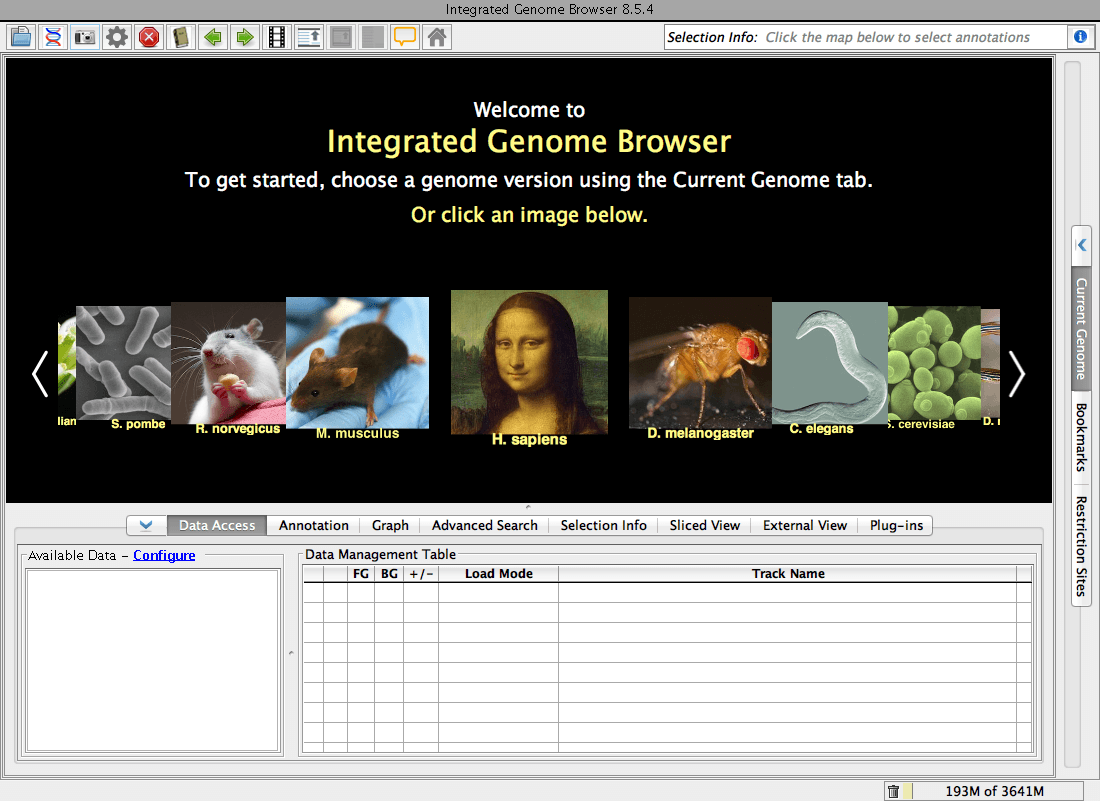
IGB start screen.
-
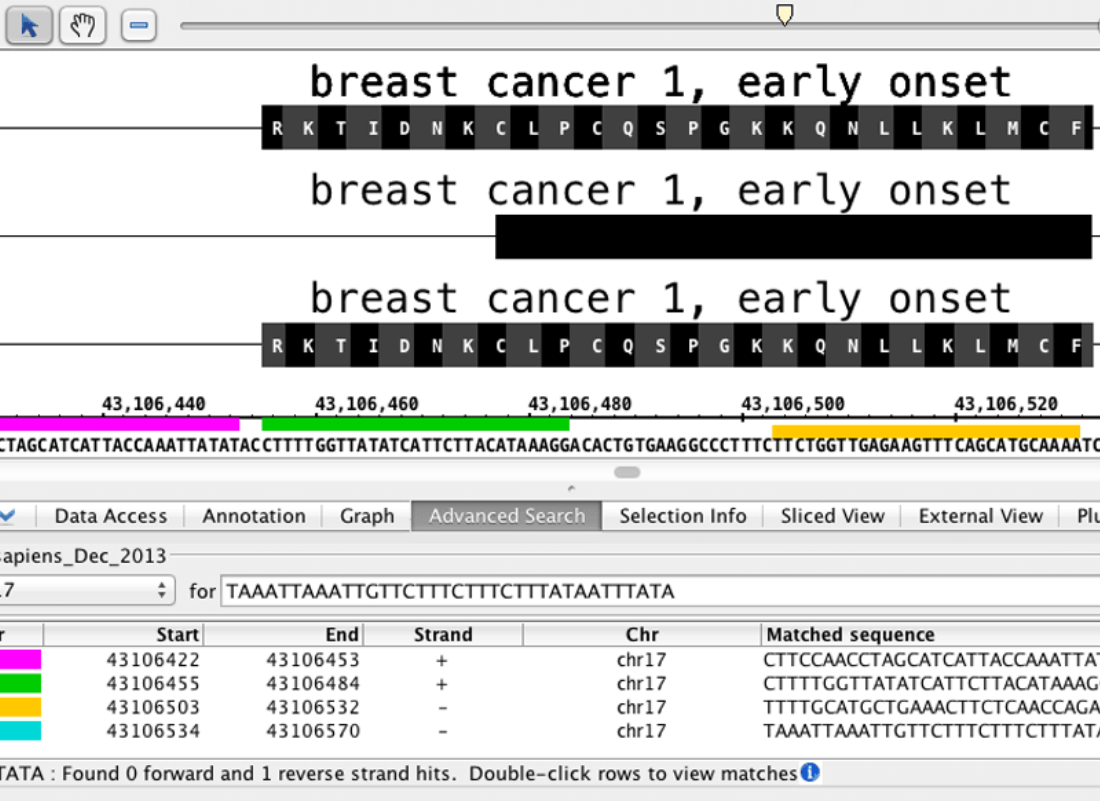
Close-up on BRCA1, with PCR primers.
-
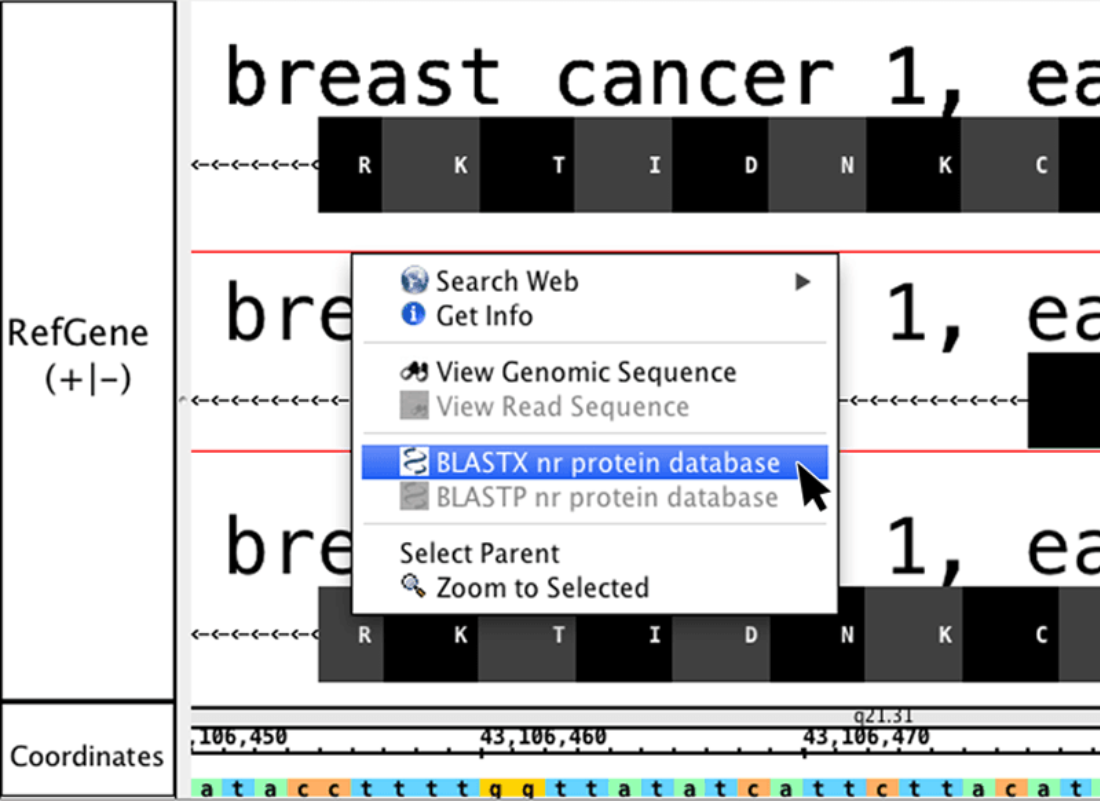
Right-click to run BLAST.
-
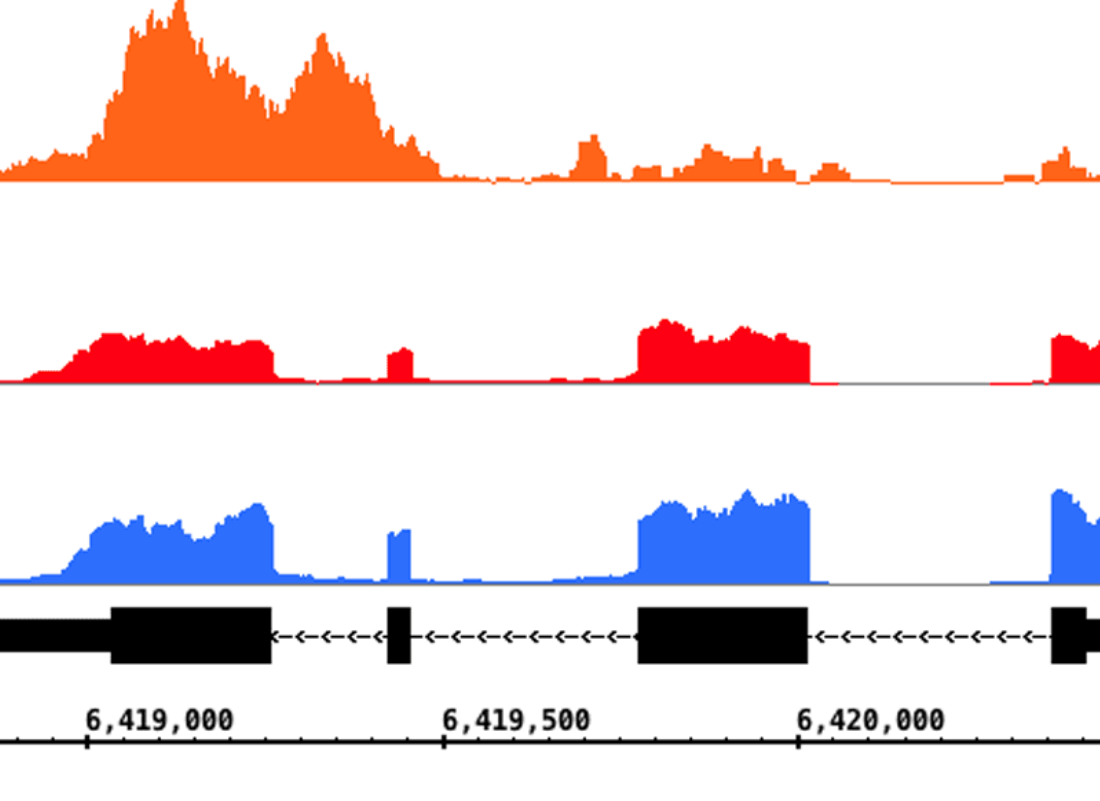
RNA-Seq coverage graphs highlight alternative splicing.
-
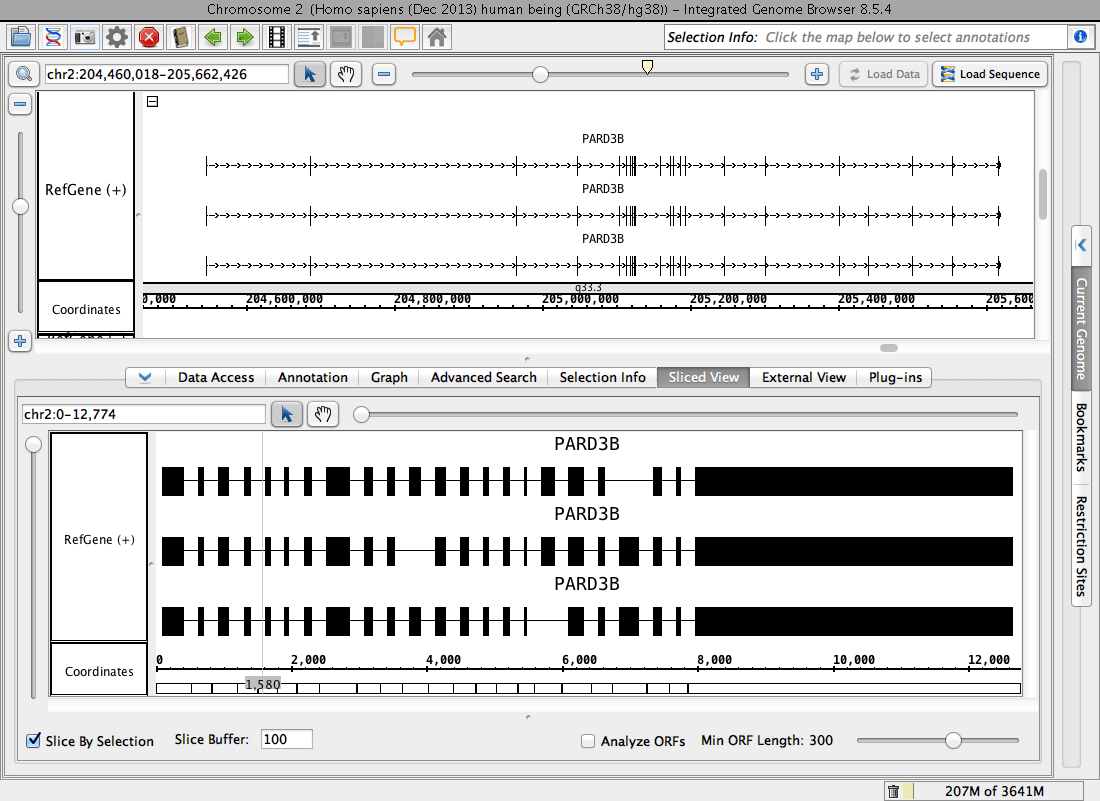
Sliced view trims introns; makes gene structures easier to understand.
-
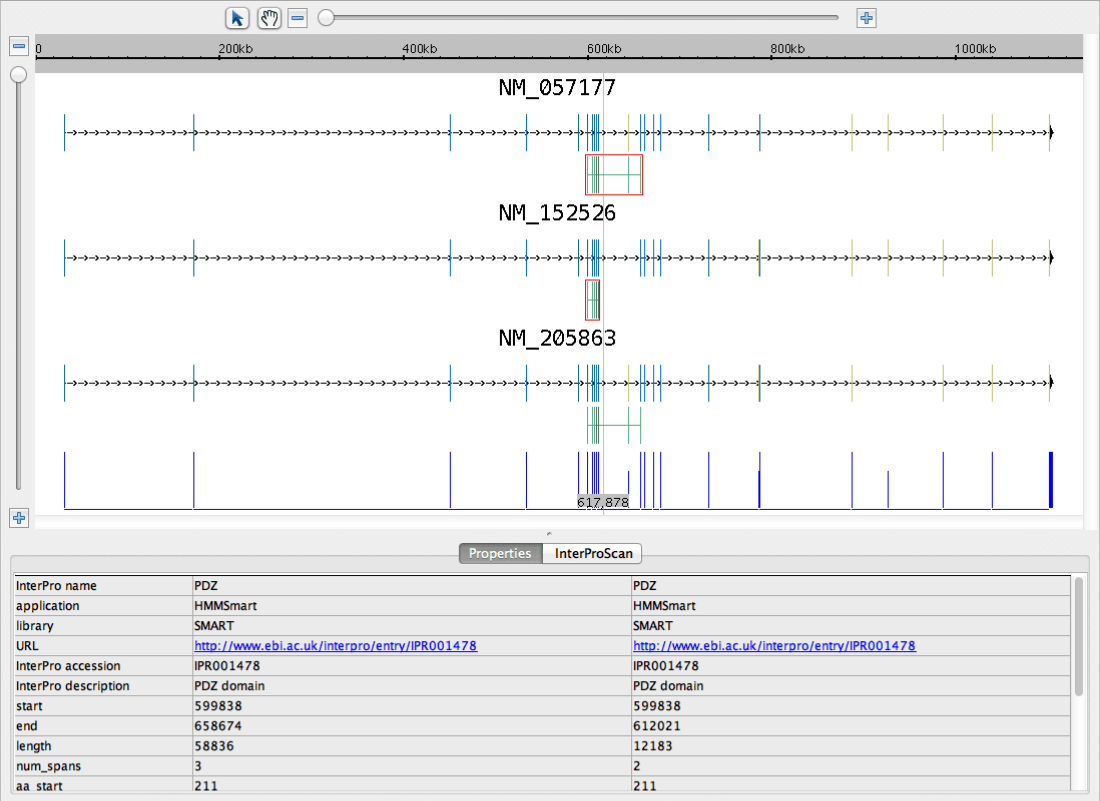
Use ProtAnnot to search InterProt for conserved motifs, find out how splicing changes gene function.

What is IGB?
IGB is a fast, flexible, and free genome browser you can use to explore & visually analyze vast genomic data. IGB runs on your desktop and loads data from local files or the internet. To learn more, check out IGB Overview.
Track Hubs
Viewing the same data in different genome browsers improves understanding, so we built a tool to open and view UCSC Genome Browser Track Hubs in IGB. You can try it here.
Early Access IGB
Want to know what's coming? Download an upcoming IGB version, a work-in-progress.